Analysis beyond the form: validated templates, code and the MerQur core in one place
MerQuR+ is an analysis environment built on the MerQur core that works with a license key. It contains MerQur's 170 form-based analyses, seven map methods and APA 7 reports, and adds 226 validated R and Python templates and a Code tab for analyses that a form cannot express. The parameters of every template are set in one window, the results pass to cards and the report, and the software and packages used are listed with their official citations.
Integrated Academic Data Analysis & Reporting PlatformAnalyze, Modelling, Interpret, Reporting. The program is built around these four steps.
Of the 226 templates, 196 are written in R and 30 in Python. Each template was checked against a published source (package vignette, textbook table or article) and, where an equivalent procedure exists, against SAS; where R and SAS define a quantity differently, the template states which definition it uses.
| Category | Templates | Example templates |
|---|---|---|
| Genetics and DNA data | 32 | Family-based transmission/disequilibrium test; Haplotype network; Multiple sequence alignment |
| Time series | 24 | ARDL and nonlinear ARDL; Markov-switching regression; Multiple structural breaks |
| Causal inference and econometrics | 19 | Balancing weights; Regression discontinuity design; Sensitivity to omitted variables |
| Custom models | 18 | Four-parameter logistic dose-response; Panel count models; Bivariate and recursive probit |
| Mixed models (R) | 15 | Linear quantile mixed model; Non-compartmental pharmacokinetic analysis; Multivariate-response linear mixed model |
| Survival analysis | 14 | Interval-censored regression; Discrete-time survival model; Multi-state model |
| Design of experiments | 13 | Alpha and lattice designs; Location × year combined randomized complete blocks; Cross-over trials |
| Multivariate, high-dimensional and dependence | 11 | Bayesian networks; Group lasso and grouped penalties; Social network analysis |
| Psychometrics | 10 | Cognitive diagnosis models; Mokken scale analysis; Advanced differential item functioning |
| Structural equation and latent variables | 9 | Exploratory structural equation modelling; Latent interaction models; Multilevel confirmatory factor analysis / SEM |
| Meta-analysis | 8 | Network meta-analysis; Publication bias; Multilevel |
| Spatial statistics | 8 | Bayesian areal model; Point process models; Multiscale geographically weighted regression |
| Statistical process control and reliability | 7 | CUSUM and EWMA control charts; Attributes control charts; Multivariate control chart |
| Ecology | 6 | Occupancy, N-mixture and capture-recapture models; PERMANOVA and Mantel test; Diversity indices and rarefaction curve |
| Resampling | 6 | Bootstrap for dependent data; Stratified / blocked permutation test; Resampling-based multiple testing |
| Survey sampling and small area estimation | 4 | Survey sample selection; Small area estimation; Hot-deck imputation |
| Simulation and power | 4 | Simulation-based power analysis; NIST SP 800-22 randomness tests; Type I error and CI coverage simulation |
| Smoothing and additive models | 4 | GAMLSS; Censored quantile regression; Multivariate adaptive regression splines |
| Bayesian methods | 3 | Bayesian model averaging; Bayesian multilevel; MCMC with a user-defined likelihood and prior |
| Method comparison | 3 | Reference intervals by group; Parametric; Method comparison |
| Missing data and multiple imputation | 2 | Reference-based multiple imputation; Multilevel multiple imputation |
| Getting started | 2 | Blank template; Blank template |
| Extreme values | 2 | Extreme value analysis; Extreme value analysis |
| Finance | 1 | Conditional extreme value VaR/ES |
| Text analysis and topic models | 1 | Structural topic model |
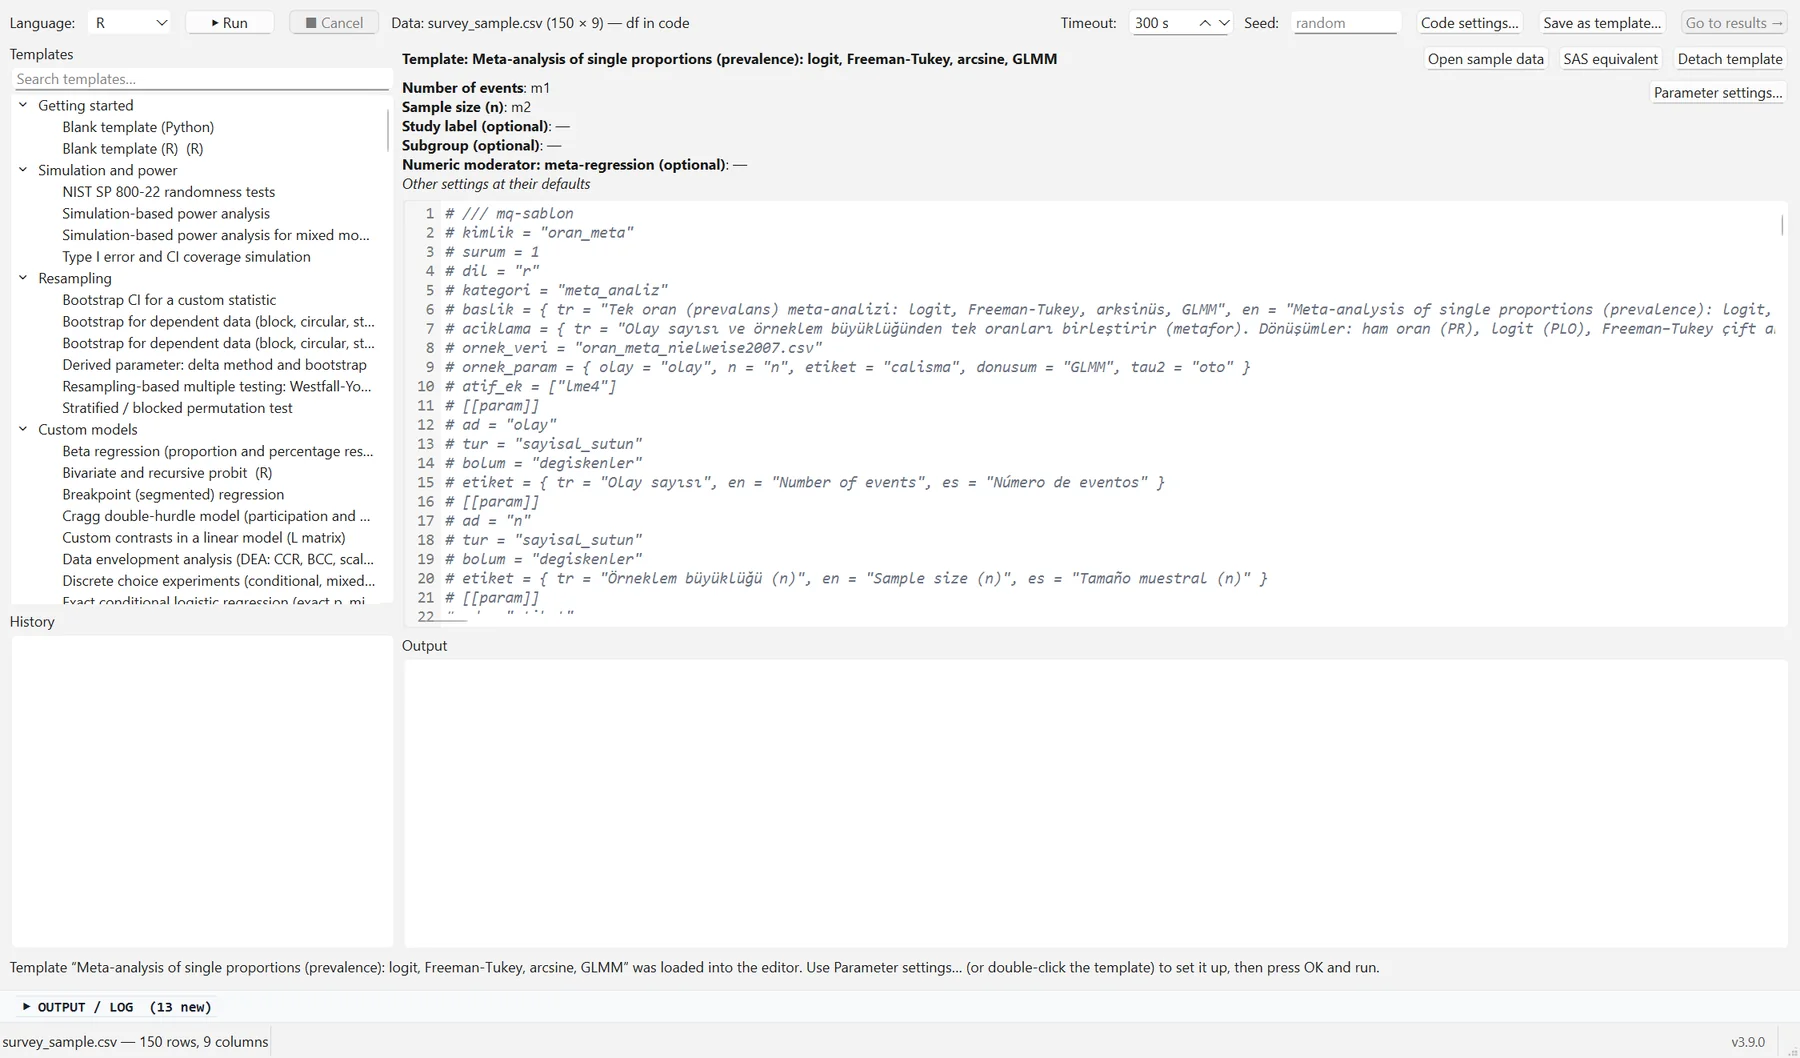
Every template has sample data and sample settings; the output text, tables, comments and SAS equivalents are translated into Turkish, English and Spanish. MrBayes 3.2.9 comes with the program for Bayesian phylogenetics.
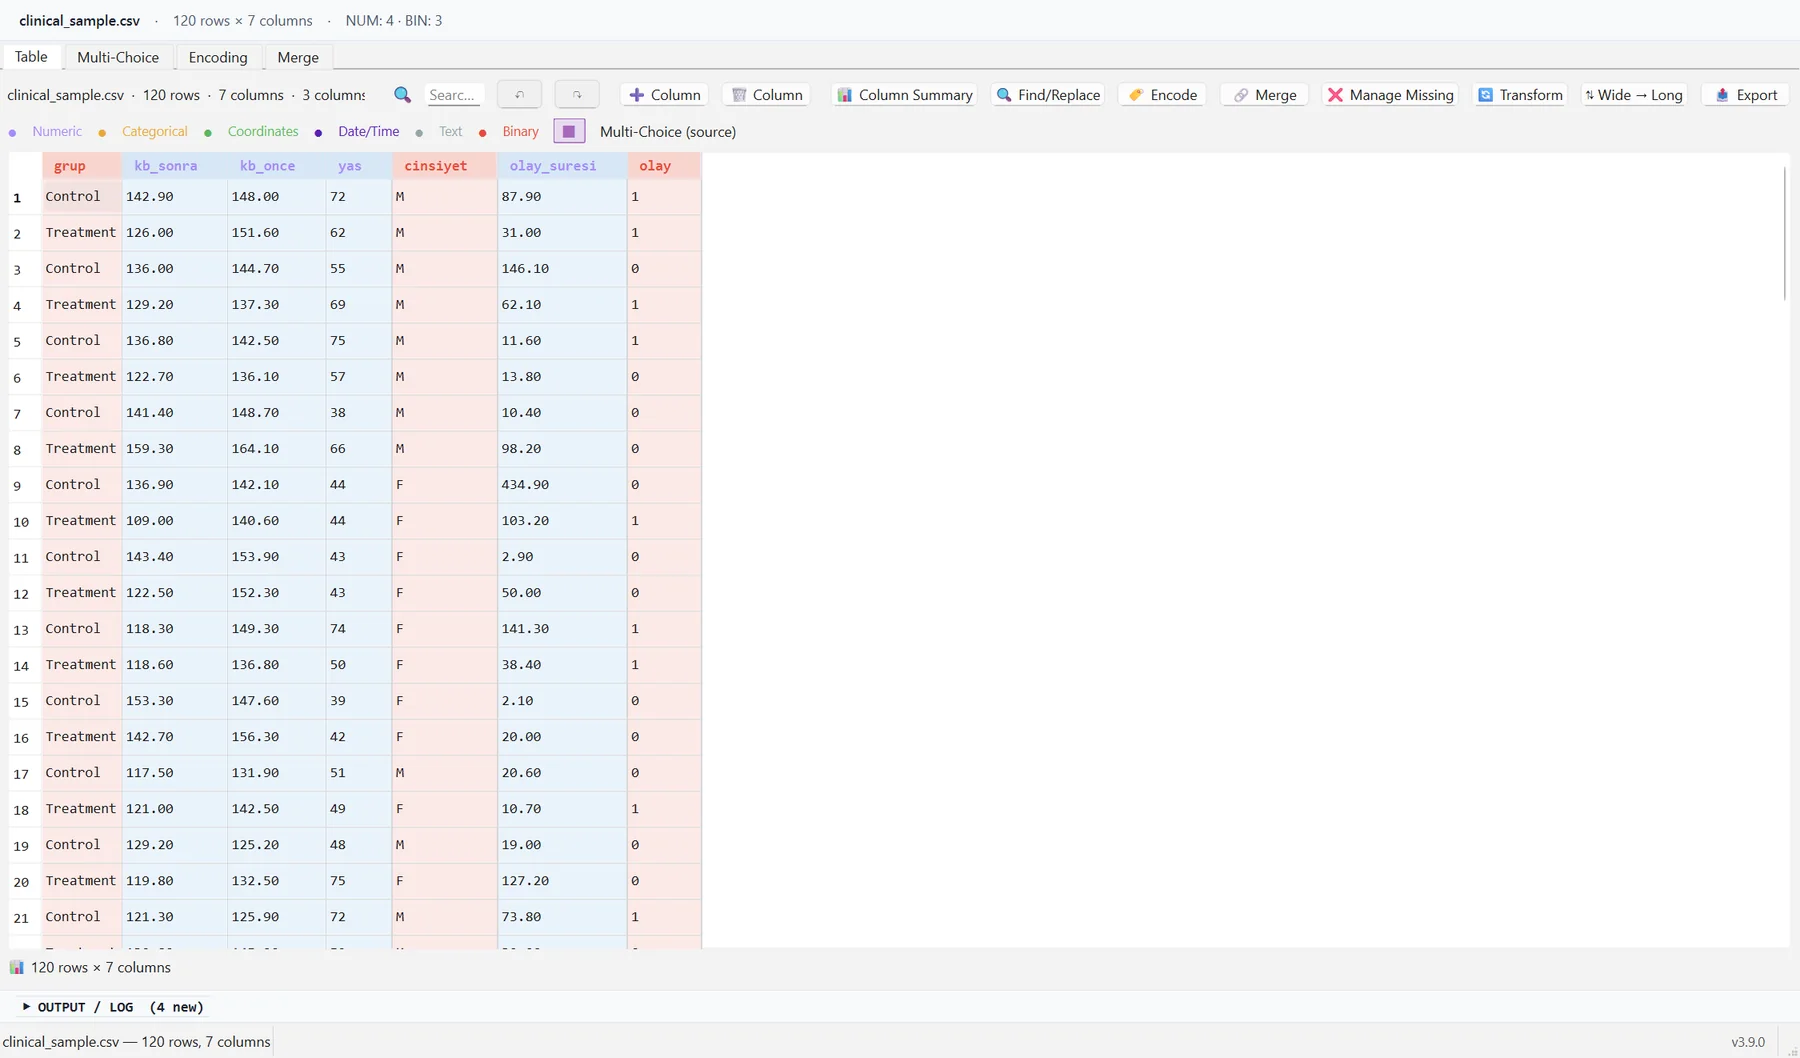
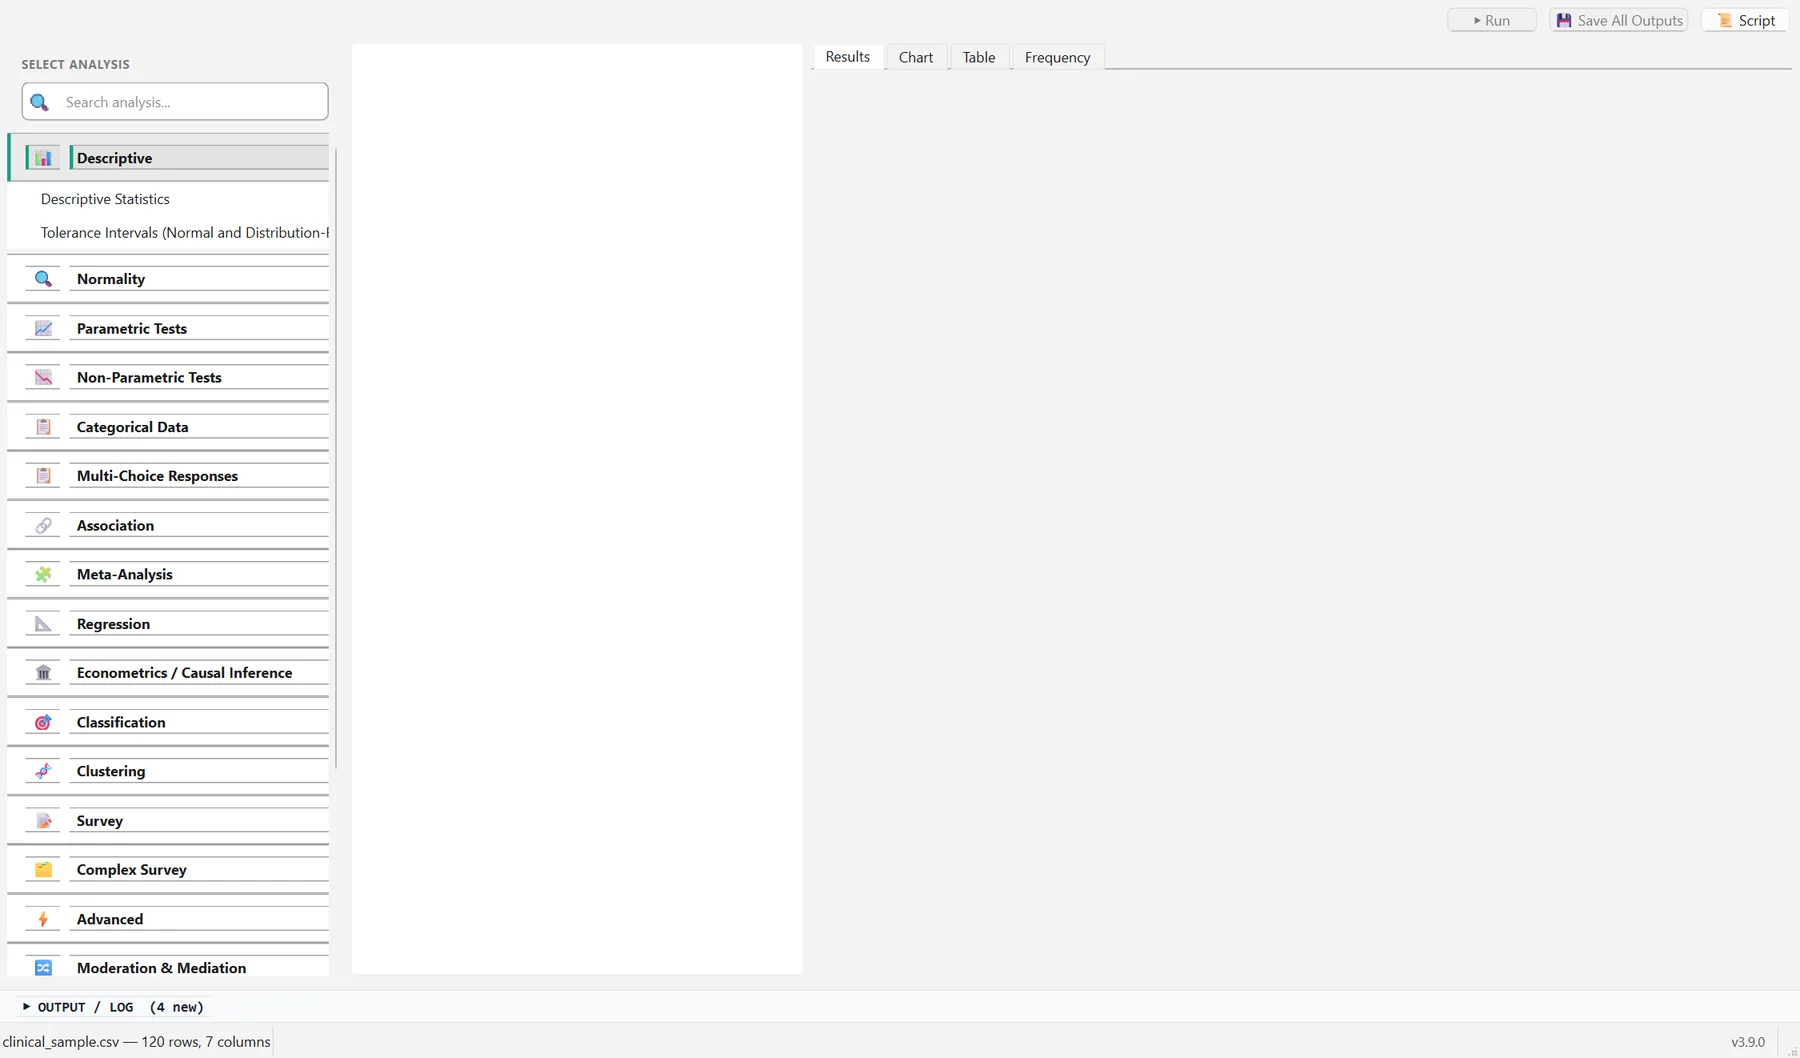
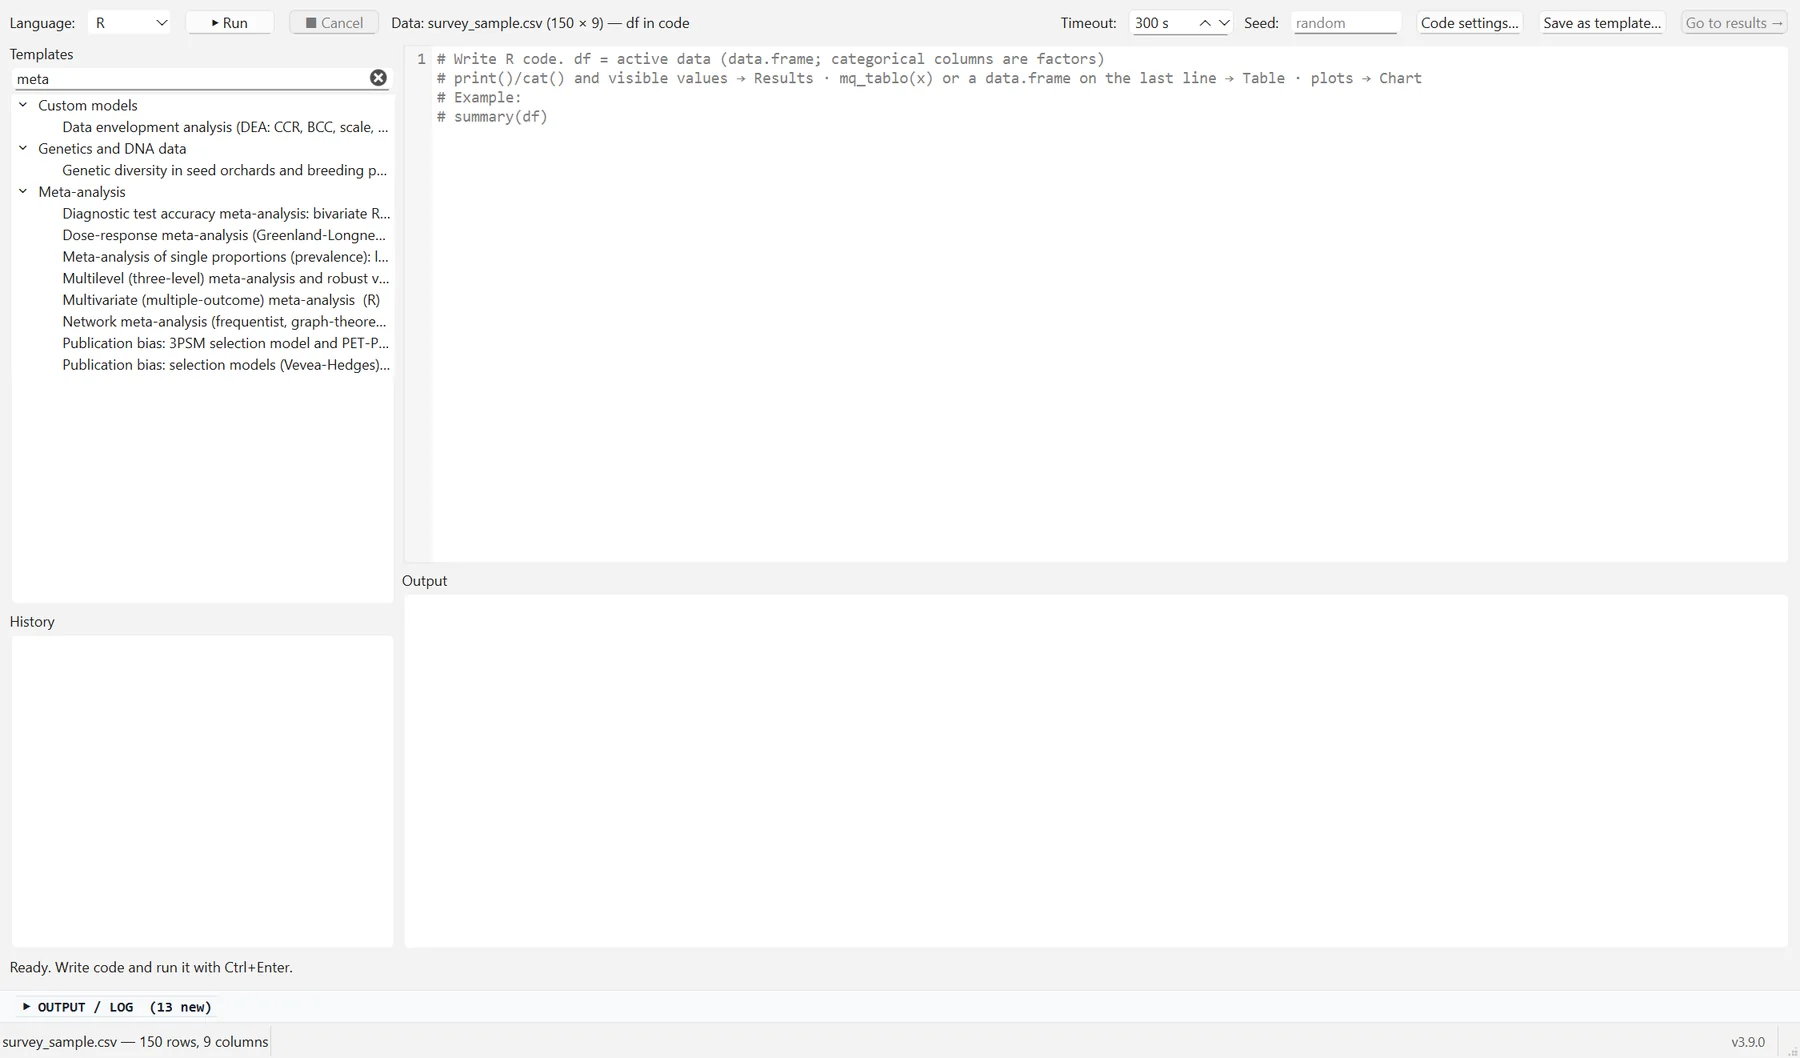
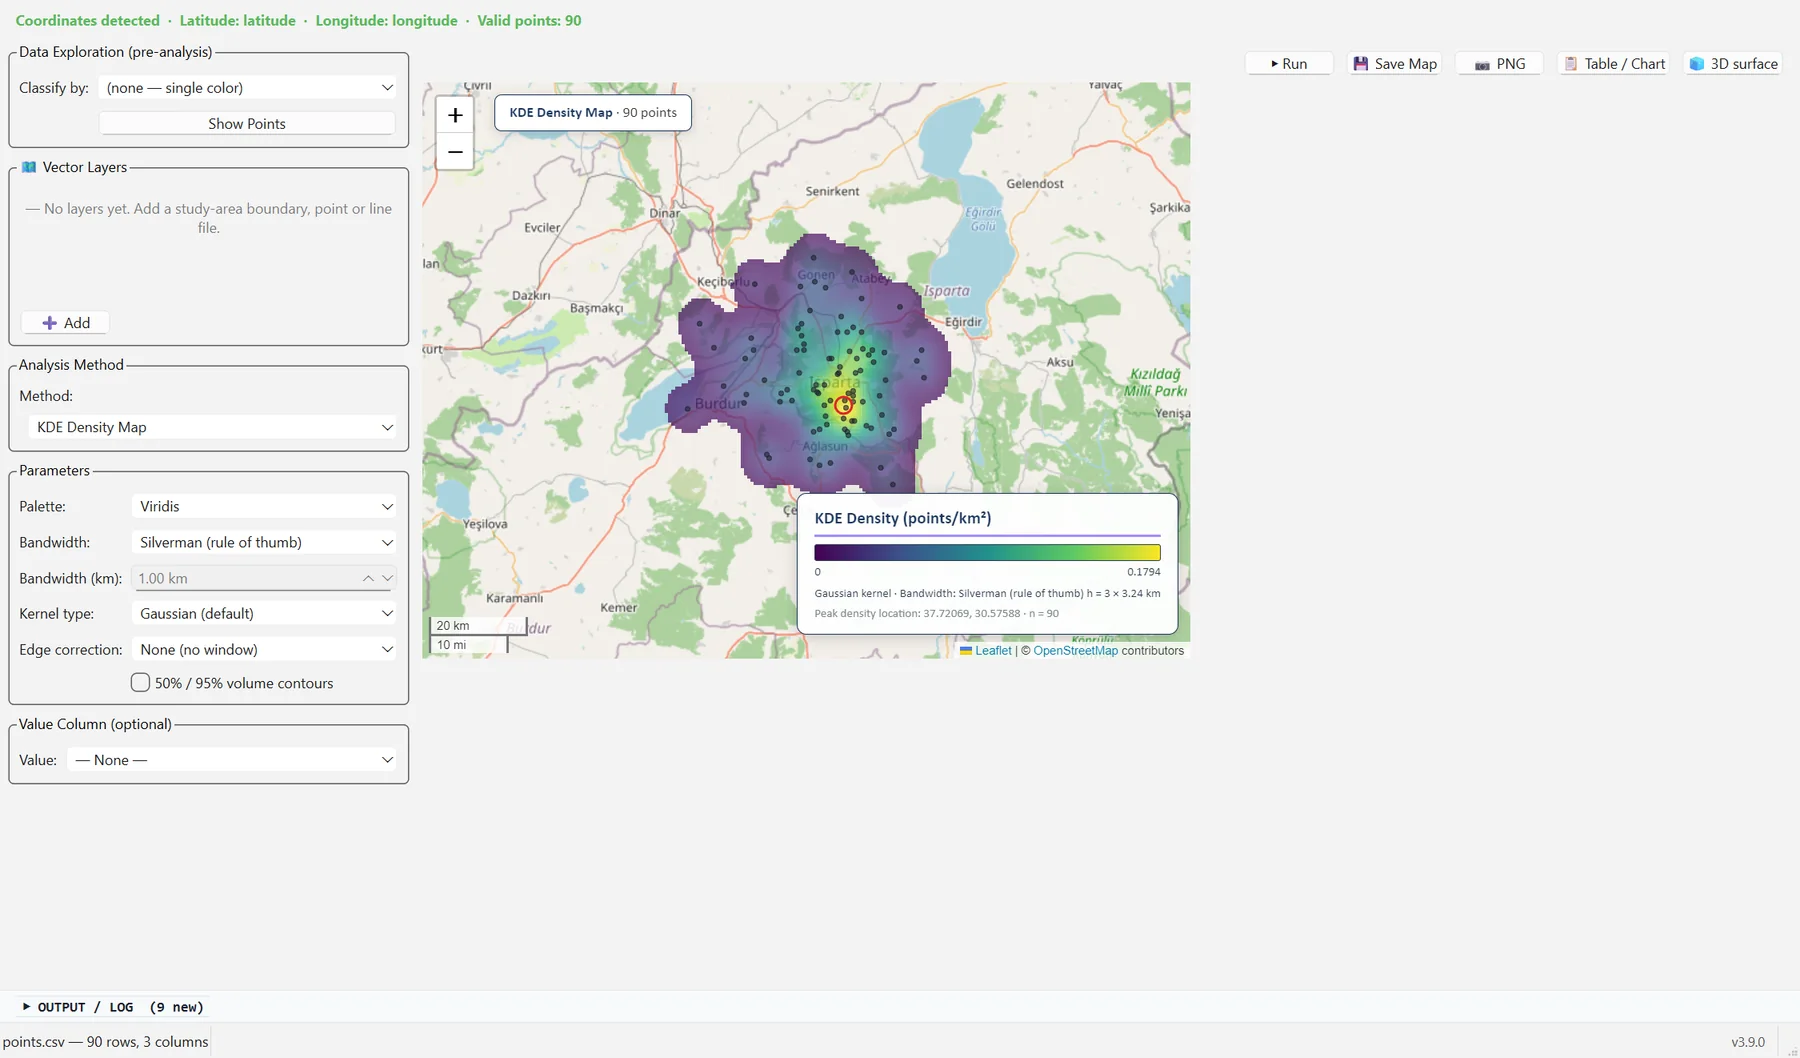
The window below is the program itself: click the tabs. The tab names and their order are the same as in the program; in each tab the screenshots are switched with the small thumbnails. The screenshots were taken with a sample clinical data set (120 patients) and with the templates' own sample data.
Data
The Data tab is where the table loaded into the program is prepared. Data imported from the File menu or typed in by hand is shown, edited, transformed and encoded here. Every analysis, template, map and report in the other tabs uses the data in this table.
Use it before starting an analysis to check data quality, manage missing values, transform columns, merge two tables and encode categorical columns numerically. Problems found during analysis are also fixed here.
Analyze
The Analyze tab holds the form-based analyses of the MerQur core. The left sidebar lists the categories, the middle shows the parameter form of the chosen analysis and the right holds the result cards. The base version of this release is MerQur 2.9.0; 170 analyses in 21 categories run from this tab.
Use it for standard analyses whose method is known and whose parameters can be expressed in a form: descriptive statistics, normality, parametric and non-parametric tests, regression, survival, multivariate methods, survey and time-series analyses. For analyses that a form cannot express or that need a custom model, use the templates in the Code tab.
Code
The Code tab combines the library of validated R and Python templates that come with MerQuR+ with an editor in which you can write and run your own code. Templates run through a parameter window; the results are added as cards in the Analyze tab and to the software and citation list in the Report tab.
Choose a template for methods that a standard form cannot express (advanced econometrics, clinical prediction models, phylogenetics, forest tree breeding, custom models, simulations). The template code is visible and can be changed; it runs in a separate process with the time limit and memory limit set in Code settings.
Map
The Map tab shows data that has coordinate columns on a map and analyses it with seven spatial methods. If no coordinate column is found in the data, a warning is written at the top of the tab.
Use it to map the density, clustering, spatial association or estimated surface of point data. More advanced spatial models (space-time kriging, MGWR, areal Bayesian CAR, point processes) are run with templates in the Code tab.
Survey
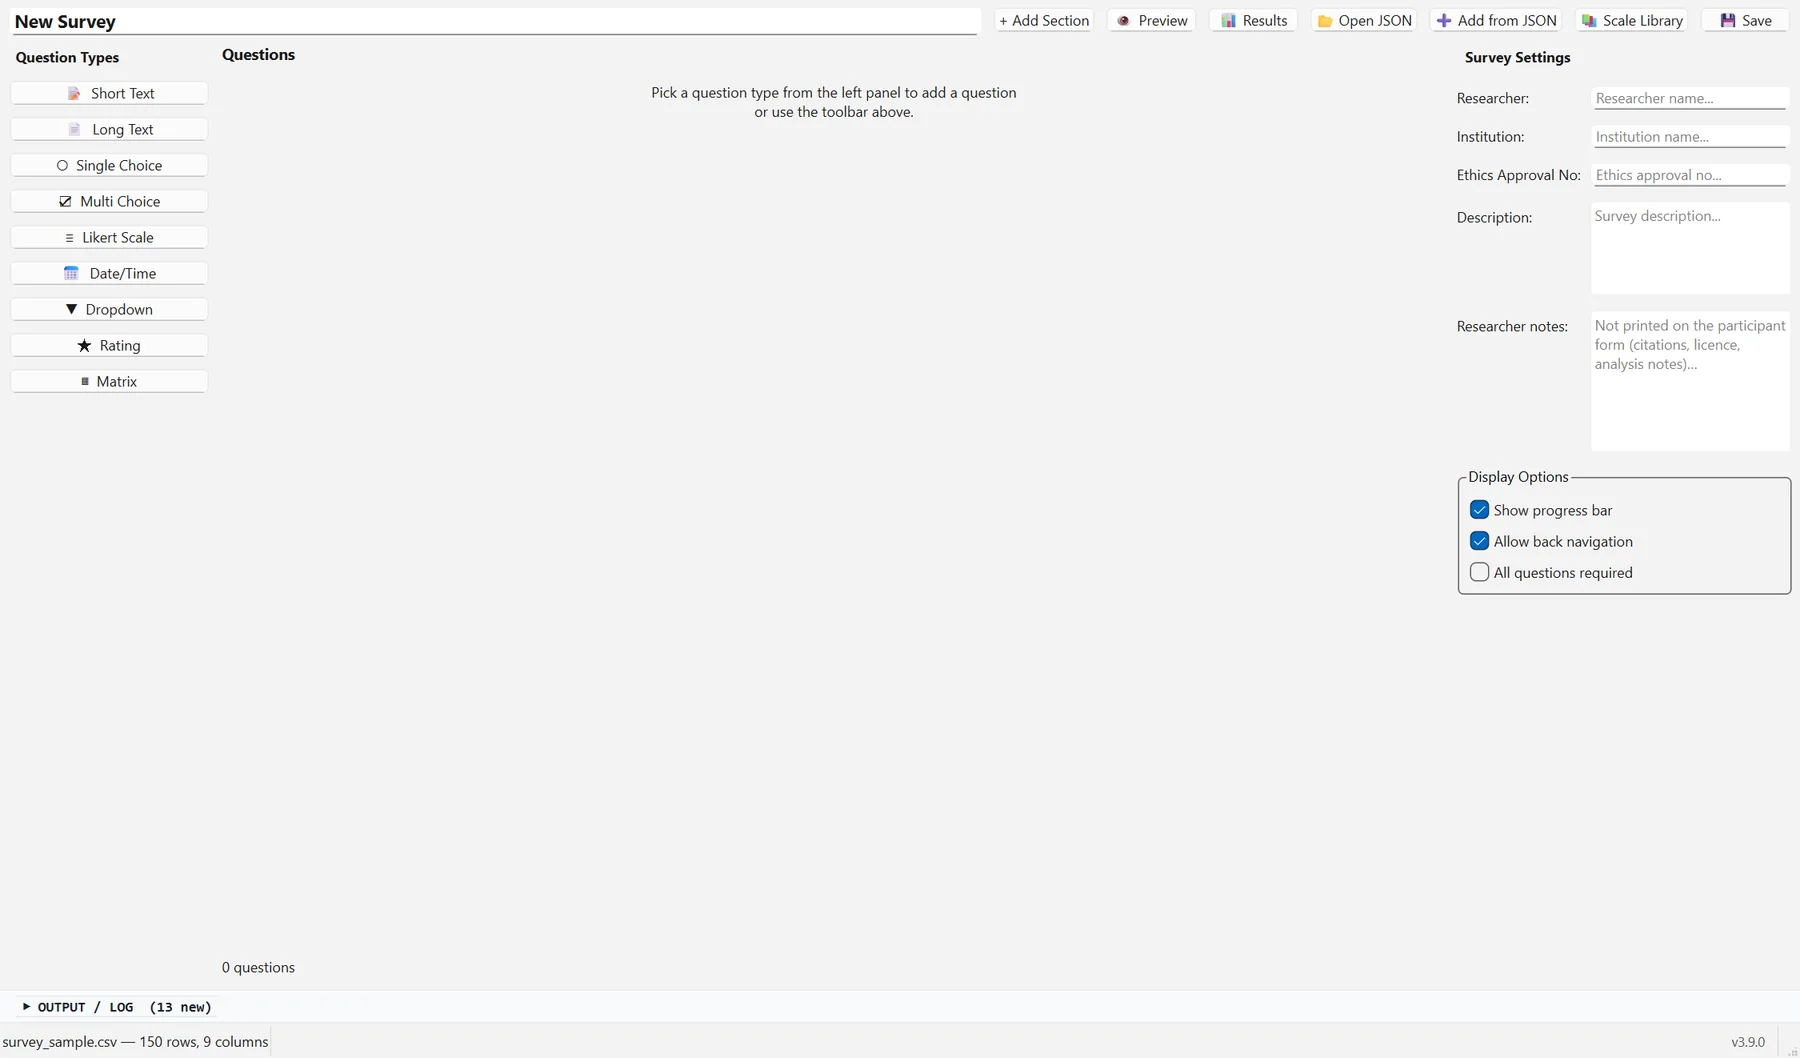
The Survey tab is an editor for designing an online survey form. Questions are built in sections, previewed and saved as a JSON file; ready-made scale modules are added from the library.
Use it to prepare a question form before data collection, to add published scales to a survey or to see the results of collected multiple-choice answers. The collected responses are brought into the Data tab and analysed with the Survey and Complex Survey analyses in the Analyze tab.
Report
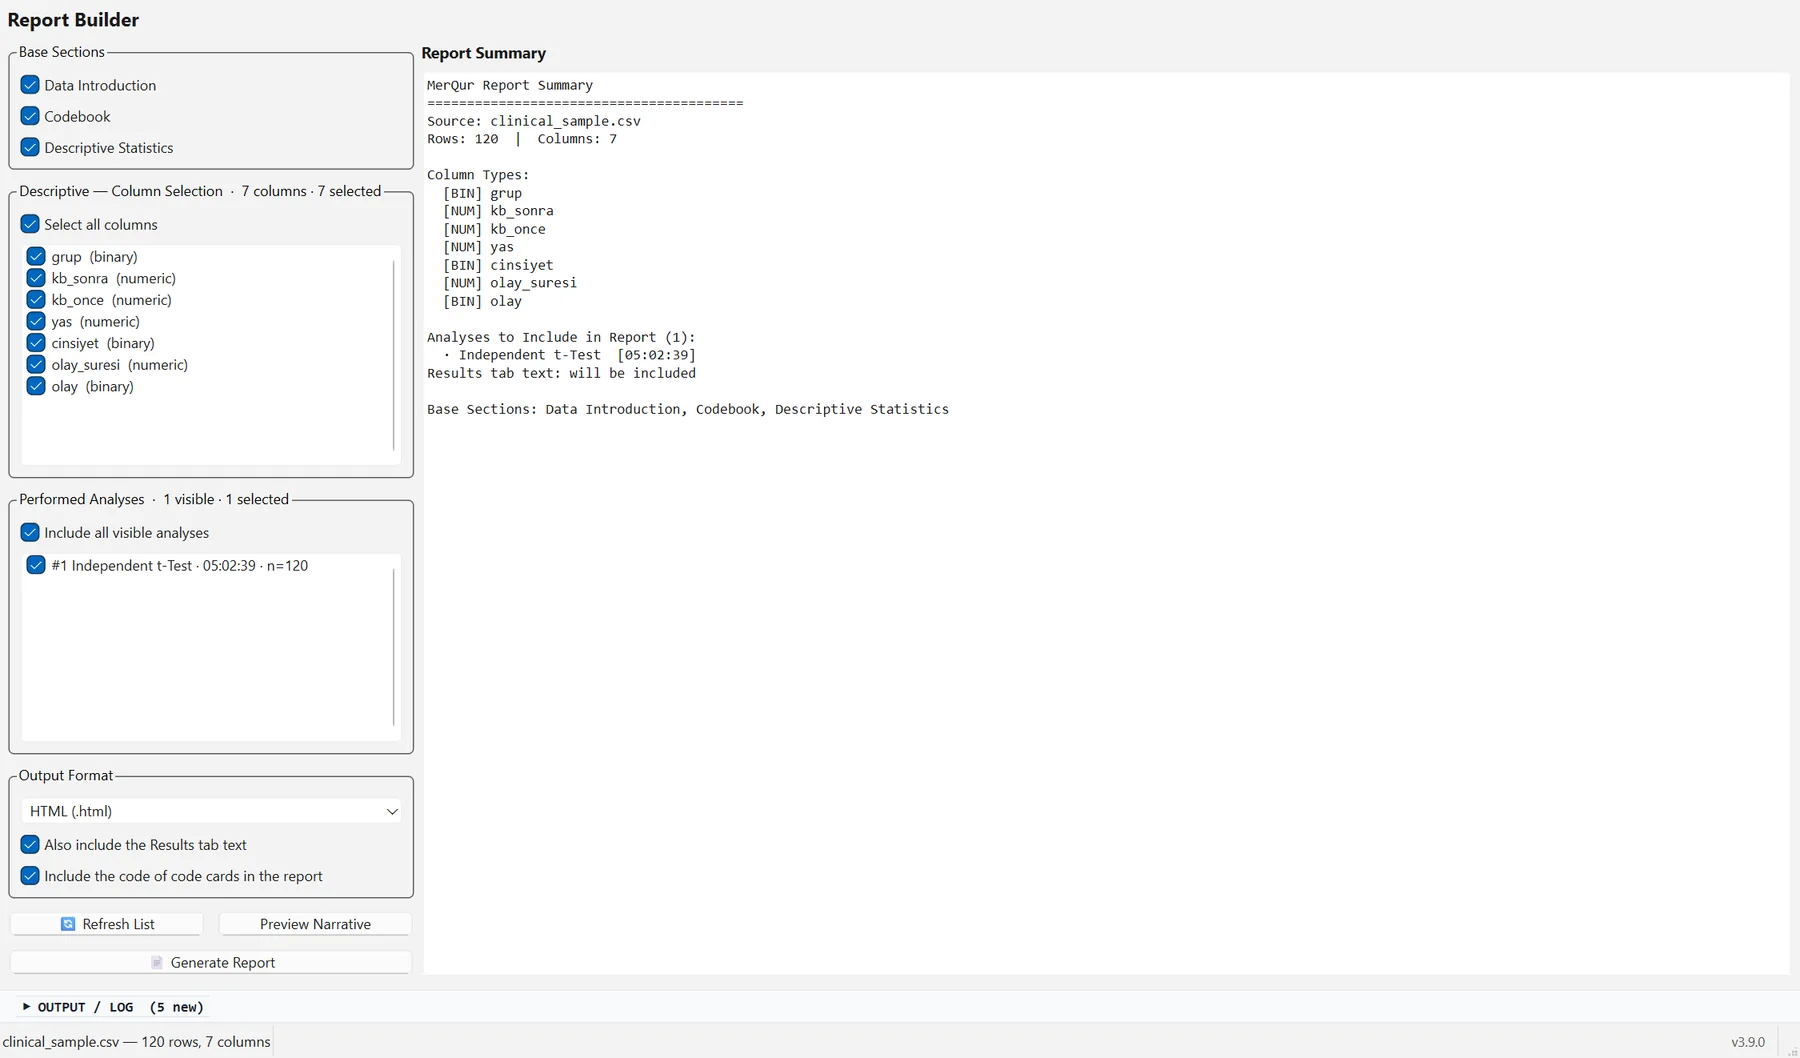
The Report tab gathers the data introduction of the session, the codebook and the cards of the chosen analyses in one report. Every report lists the software used and the package versions with their official citations.
Use it when the work is finished to export the results as an appendix to a paper or thesis. The report computes nothing new; it compiles the existing results, tables and interpretive sentences.
Tools
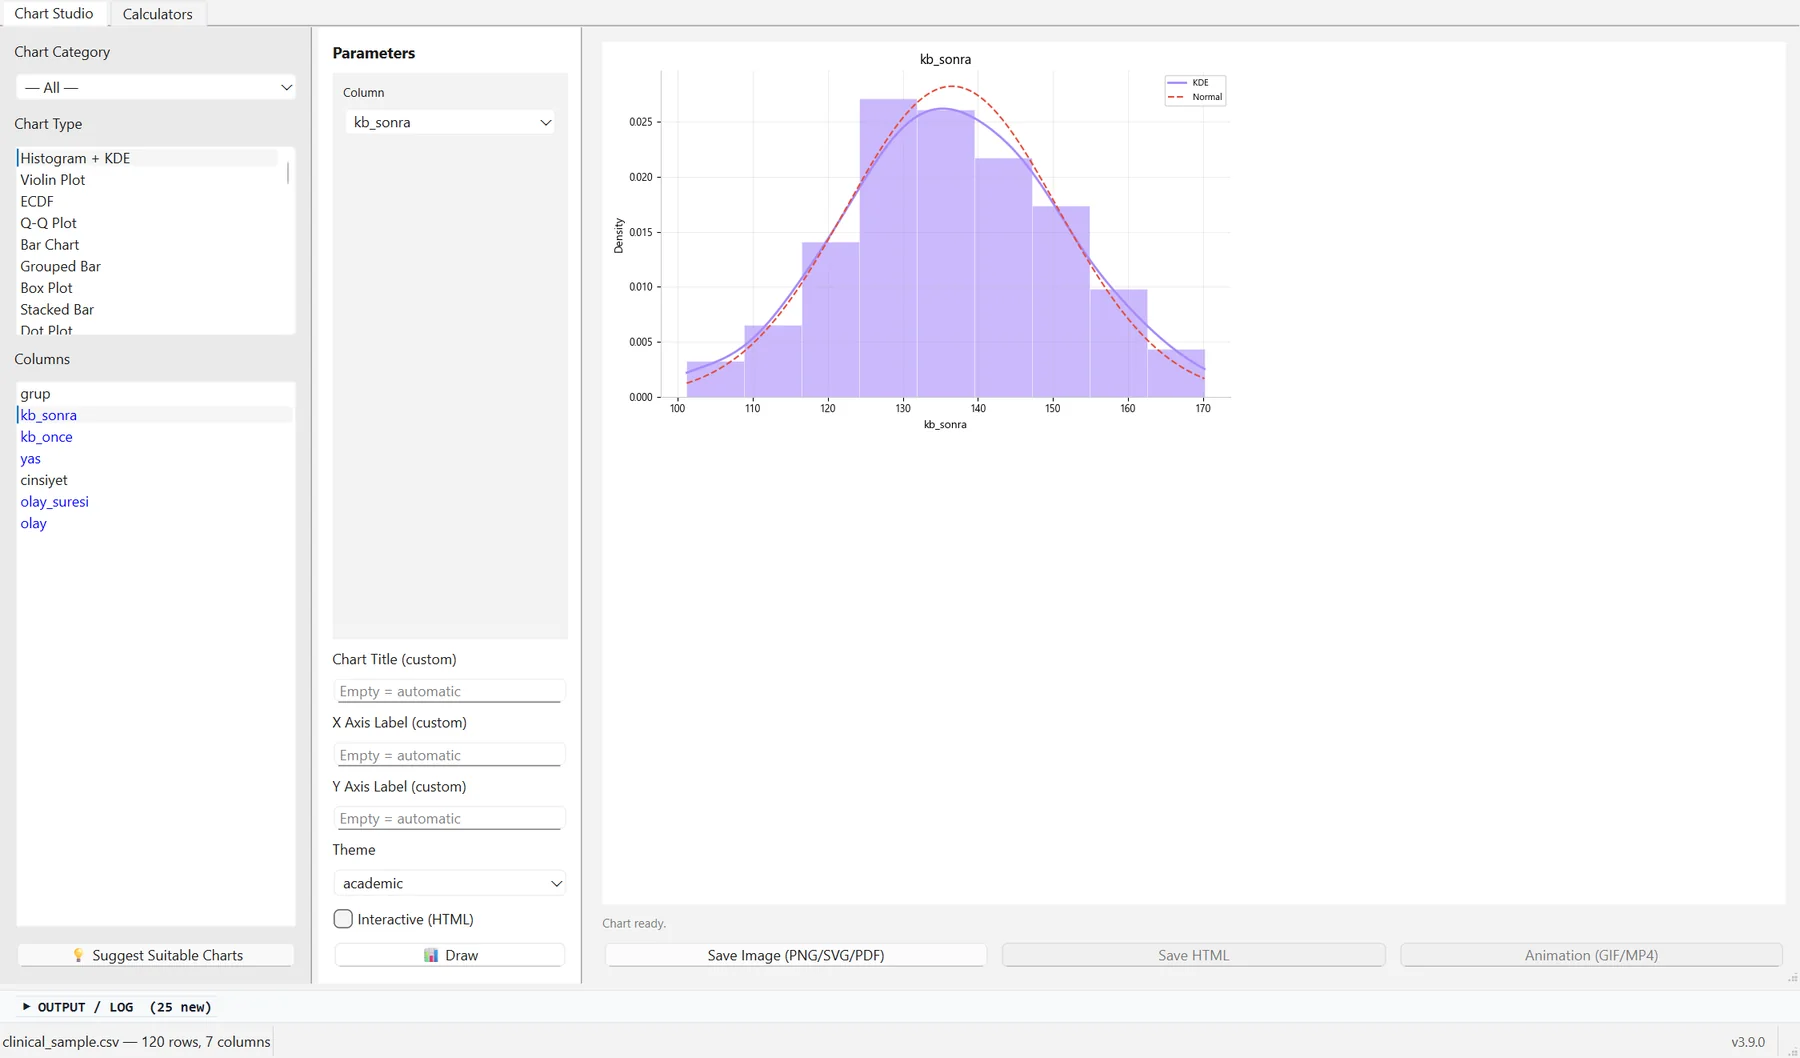
The Tools tab has two sub-tabs: Chart Studio for designing charts, and the study-planning tools that can be used without any data loaded.
Chart Studio is used to prepare charts from data independently of an analysis result. The calculators are for deciding the sample size and the experimental plan while a study is being planned.
Help
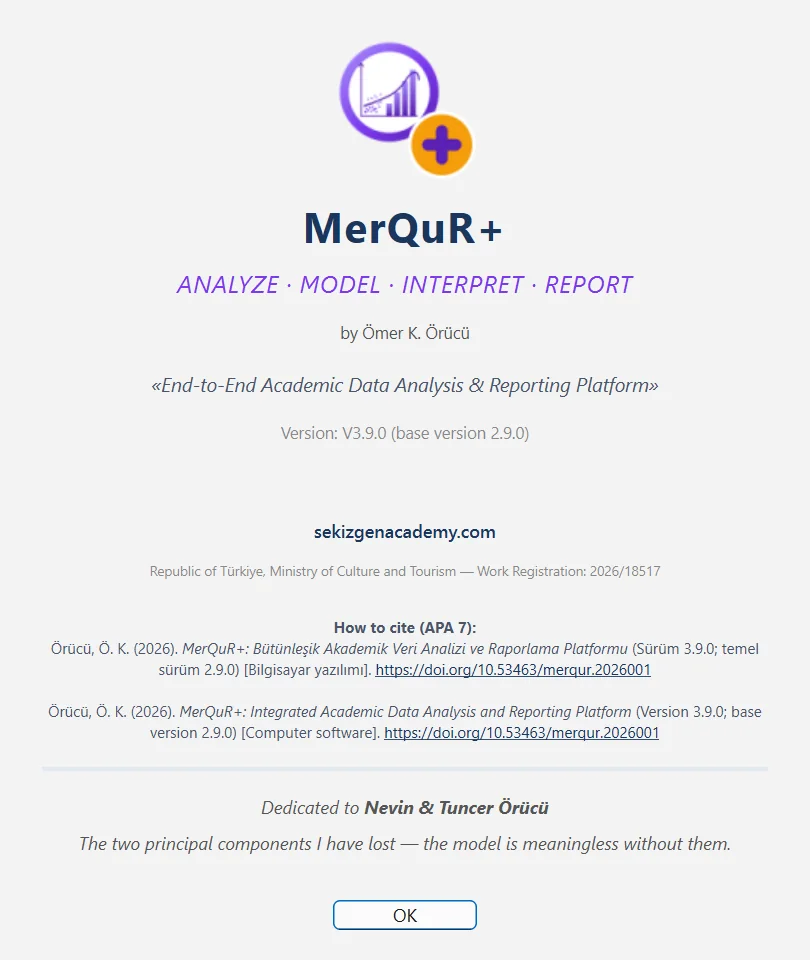
The File and Help menus at the top of the window are independent of the tabs. The About window shows the version, the base version, the citation and the work registration.
It contains Import Data, Import from Excel (choosing sheet and columns), Import from Geotagged Photos, New Blank Sheet, Open Project, Save Project and Save As, Recent Files, Export Data and Outputs, Analysis Script, Reset All, Settings and Exit.
For each template it describes the purpose, inputs, sample data, method and formulas, code steps, hand calculation, reading the output, common errors and references. Every chapter is a separate page and the book is searchable. The book is published in Turkish.
The installer is published on the GitHub release page and is signed with an Authenticode certificate issued to the developer (publisher: Ömer Kamil Örücü).
| Platform | File | Description |
|---|---|---|
| Windows 10/11 x64 | MerQuRPlus-3.9.0-windows-x64-Setup.exe | The installer installs side by side with MerQur, detects R and, if needed, downloads and installs R, Rtools and the R packages. |
Requirements: Windows 10/11 64-bit · about 1.5 GB disk · 8 GB memory recommended · R 4.3 or later for the R templates · internet is needed only during installation. macOS and Linux builds are not available yet. · All releases
License. MerQuR+ works with a personal license key valid for one year; without a key the program does not open. On the first start the user agreement is read and accepted, then the key is entered. Licenses are issued through the authorized distributor Sekizgen Academy. For a license: info@sekizgenacademy.com
If MerQuR+ contributes to a publication, please cite:
Developer: Ömer K. ÖRÜCÜ. The source code is not public; this page is for distribution and documentation. The software and packages used are listed in every report with their own licenses and citations.
Registered work: T.C. Ministry of Culture and Tourism, 2026/18517.